Scenario analysis: 31 indicators for productivity, efficiency and sustainability
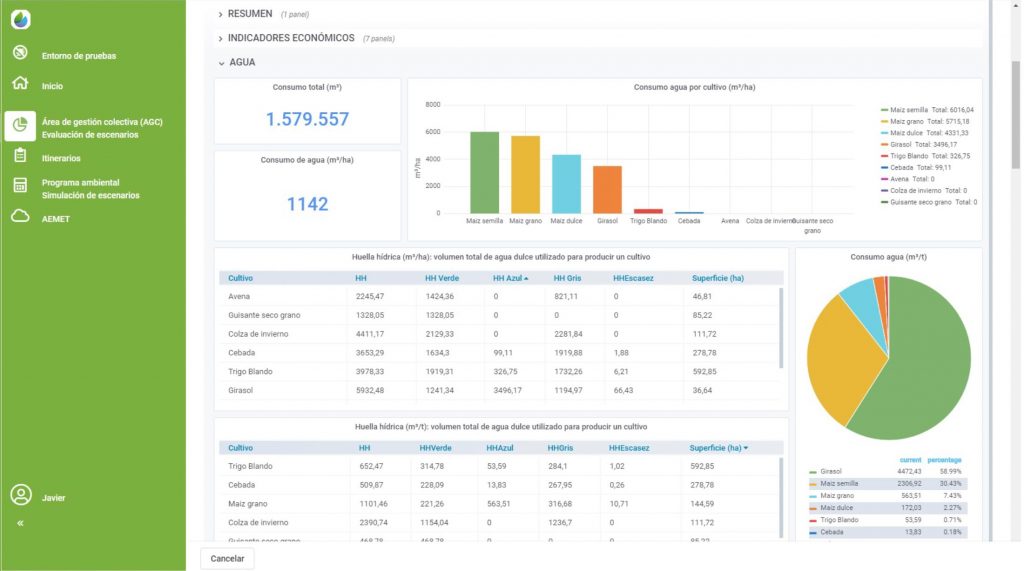
AGROgestor provides a dashboard, a kind of “summary” that collects data from all plots/users in a single place and presents them in a “digestible” way. It allows data analysis and decision making through 31 indicators that are grouped into the following blocks:
- Economic: Production and gross margin.
- Water use: Water consumption, water productivity and Water footprint and its components (blue, green and gray). Water Stress Index.
- Nitrogen Management: Consumption of total, mineral and organic N. Organic N in relation to total N, excess N, contribution of N from irrigation water.
- Phosphorus Management: Consumption of total, mineral, and organic P2O5. % of organic P over total P, excess of P2O5.
- Balance of emissions: Carbon footprint and energy.
- Use of phytosanitary products: Number of phytosanitary treatments in a campaign, toxicity in fresh and marine water, terrestrial and human toxicity.
- Biodiversity: Different crops in rotation in the last 4 years, incorporation of legumes in the last 4 years.


